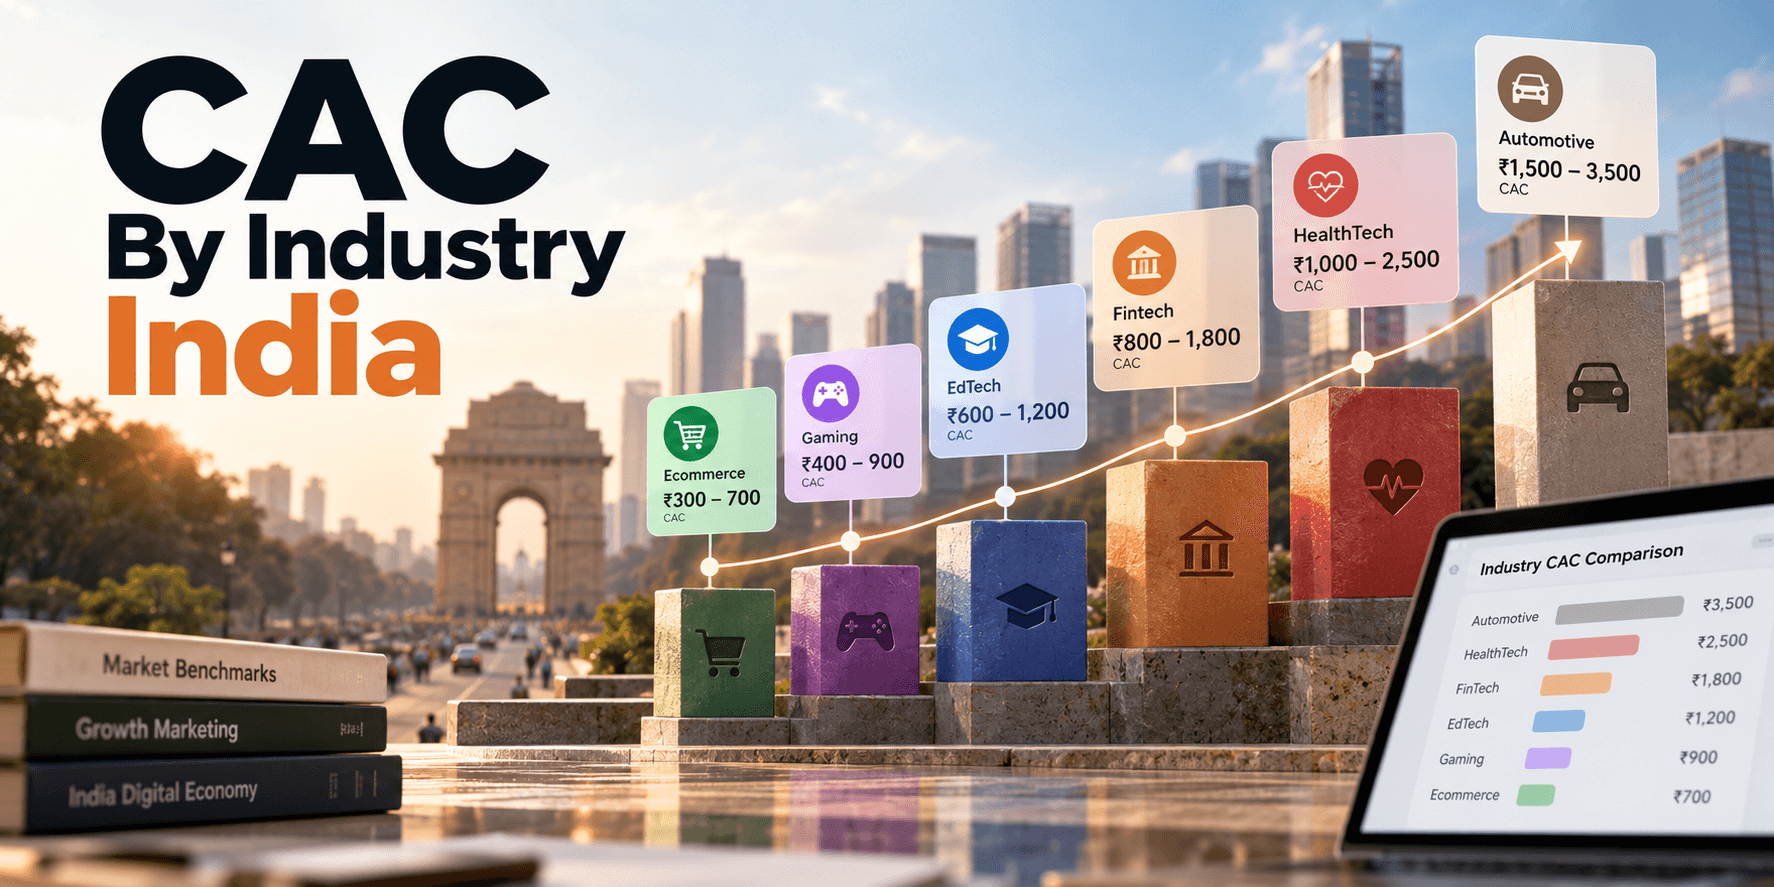
India CAC Benchmarks 2026: What Data Actually Exists
India's median Meta CPC is about $0.10 vs $1.05 globally (Superads), but we found no credible India CAC-by-industry study. Here's what data actually holds up.
By Abhilash LR
Searching for average CAC by industry in India returns mostly US and Western European figures with an India label attached. This post separates what is verifiable from what is not, shows the India cost data that exists, and explains how to calculate and judge your own customer acquisition cost. For wider context, see our CAC benchmarks for Southeast Asia and India and CAC by industry in Southeast Asia.
Key Takeaways
- We found no credible, India-specific, by-industry CAC study in the sources we opened. The only India CAC ranges we found are unsourced vendor figures, and the widely quoted dollar figures are scoped to US and Western European operators.
- The Western baseline is blended, not paid: median ecommerce CAC is about $87 and DTC apparel about $94. Digital Applied reports paid CAC at roughly 2.4-3.1x blended CAC (April 2026).
- India's cost-per-click gap is real: Superads reports a median Meta CPC of about $0.10 in India against roughly $1.05 globally. CAC also depends on conversion rate, so we do not shrink Western CAC by that ratio.
- Your own number beats any benchmark. Platform dashboards and store orders rarely match, so calculate CAC from store orders.
What CAC data actually exists for India?
Very little that you can audit. Dollar benchmarks come from US and Western European operators, and the rupee ranges we found cite no underlying study. We opened the India pages that surfaced for these searches; only Razorpay's guide gave India CAC ranges, and Nurdd's gave India CPC and ROAS but no CAC.
| Category | CAC figure | Source / region / tier |
|---|---|---|
| Ecommerce (median, blended) | ~$87 | Digital Applied, US/Western Europe, Tier 4 aggregator |
| DTC apparel | ~$94 | Digital Applied, US/Western Europe, Tier 4 |
| Beauty and personal care | ~$71 | Digital Applied, US/Western Europe, Tier 4 |
| Consumer fintech | ~$215 | Digital Applied, US/Western Europe, Tier 4 |
| B2B SaaS (self-serve) | ~$702 | Digital Applied, US/Western Europe, Tier 4 |
| B2B fintech | ~$3,160 | Digital Applied, US/Western Europe, Tier 4 |
Unsourced vendor ranges, shown for transparency, not as benchmarks.
| Category | CAC figure | Source / region / tier |
|---|---|---|
| Beauty and personal care | ₹300-500 | Razorpay, India D2C, Tier 4 vendor, no stated source |
| Fashion and apparel | ₹500-800 | Razorpay, India D2C, Tier 4 |
| Food and beverage | ₹200-400 | Razorpay, India D2C, Tier 4 |
| Home and decor | ₹800-1,200 | Razorpay, India D2C, Tier 4 |
| Consumer electronics | ₹1,000-2,500 | Razorpay, India D2C, Tier 4 |
Digital Applied (published 21 April 2026) names HubSpot, OpenView, ChartMogul, ProfitWell/Paddle, First Page Sage and Bain & Company as inputs but does not link the underlying reports. It says paid CAC runs 2.4-3.1x blended CAC. Razorpay's guide (last edited 15 December 2025) attributes its ranges to "recent data from the Indian D2C ecosystem" without naming a study. None of this is a Tier 1-2 primary source, so treat every row as indicative and do not copy it into a board deck as a benchmark.
What India-specific cost data can you verify?
Click costs are the one India signal with a stated method. Superads reports India's median Meta CPC at about $0.104 against a global median near $1.05 (July 2025 to July 2026), roughly 90% lower. Nurdd gives rupee ranges by category, but a CPC is not a CAC.
| Metric | India figure | Source / region / tier |
|---|---|---|
| Meta median CPC | ~$0.104 vs ~$1.05 global | Superads, India, vendor aggregate, treated as Tier 3-4 (aggregated ad-account medians) |
| Meta CPC, beauty | ₹8-18 | Nurdd, Indian D2C, Tier 4 |
| Meta CPC, fashion | ₹5-12 | Nurdd, Indian D2C, Tier 4 |
| Google non-branded CPC, beauty | ₹15-45 | Nurdd, Indian D2C, Tier 4 |
| Google conversion rate, beauty | 2.1-4.3% | Nurdd, Indian D2C, Tier 4 |
Superads bases its figures on anonymised, aggregated data from ad accounts that use its platform, and reports medians because a few extreme campaigns skew averages. That makes it a useful market signal, but it is one vendor's customer base, not the whole Indian market. Nurdd states that its figures use 7-day click attribution for Meta and data-driven attribution for Google, which also limits direct comparison with other sources. Our Google Ads CPC guide for India covers click costs in more detail.
Why not just scale the $87 baseline down for India?
Because CAC is not CPC. A 90% discount on $87 would be about $9, but that figure would rest on assuming conversion rate, average order value and competition match a US store's. They usually do not, so we do not publish an India CAC derived this way. Instead, rebuild the number from India inputs and show your assumptions.
Media-only CAC is cost per click divided by conversion rate. As a transparent illustration, use Nurdd's Google beauty inputs (non-branded CPC ₹15-45, conversion rate 2.1-4.3%). The best case is ₹15 ÷ 4.3% ≈ ₹349. The worst case is ₹45 ÷ 2.1% ≈ ₹2,143. A mid-case of ₹30 at 3% gives ₹1,000. For real conversion-rate inputs, see ecommerce conversion rates in India and Indonesia.
Treat that as arithmetic, not a benchmark. It covers media spend only, ignores creative, tooling, discounts and team cost, pairs the extreme ends of two ranges, assumes every converting click is a new customer, and relies on one Tier 4 source. Its main use is showing how wide the plausible range is. Razorpay's blended beauty range of ₹300-500 sits at or below this media-only best case of ₹349, which is a reason to treat it with caution.
How do you calculate your own CAC?
Divide your total acquisition spend by the number of new customers won in the same period. Use store orders for the customer count, not platform dashboards. Platform dashboards and store orders rarely match. As an illustration, if a platform reports 130 orders and your store shows 100, a CAC calculated from platform counts comes out about 23% too low (1 - 100/130).
- Pick a window. Use at least 30-60 days, or a full sales cycle, so short-term swings do not mislead you.
- Sum the costs. Ad spend is the minimum. Add agency or freelancer fees, creative production, and discounts or free gifts used to win first orders.
- Count new customers. Take first-time buyers from your store or CRM, not platform conversions. Platforms can count a single purchase more than once when tracking is misconfigured, which is why conversion tracking setup matters.
- Split blended from paid. Blended CAC divides all spend by all new customers. Paid CAC divides ad spend by customers you can attribute to ads, and runs higher. Our guide to attribution and measurement explains why those two numbers disagree.
- Segment it. Calculate by channel, product or campaign, since a blended average hides which campaigns pay back. To track the two numbers monthly, use our blended CAC report in Google Sheets.
What should you compare your CAC against?
Compare it to your own gross margin and repeat-purchase behavior first, and to external benchmarks last. A CAC is healthy when a customer's gross profit over a realistic window comfortably exceeds it, and when you recover the spend quickly enough to fund growth.
Illustrative example, not client data: say your CAC is Rs 1,000 and a first order earns Rs 600 in gross profit. The first order leaves you Rs 400 short. That customer must reorder before the spend pays back.
- First-order margin: if CAC exceeds first-order gross profit, you rely on repeat buying to break even.
- Payback period: how many months of gross profit repay CAC. For D2C, pick a window your cash flow can carry.
- LTV to CAC: a commonly cited ratio is near 3:1. It is a rule of thumb, not a standard, and it only works if LTV is measured from real repeat data.
- Trend: a CAC that keeps climbing usually points at creative fatigue, tracking faults or channel mix. Read why CAC is increasing and how to lower CAC for D2C brands. If profitable ads still are not growing the business, read ads profitable but not growing.
How we gathered these figures
External figures come from the pages linked above, opened and read in October 2026. The CPC-to-CAC calculation is our own arithmetic on those published inputs, not a measured benchmark.
Get Your Account Audited
A benchmark cannot tell you whether your own CAC is healthy. Loupe is COACT's fixed-price, 133-point review of Meta and Google ad accounts. It costs US$199, US$299 or US$399, with reports in 3, 5 or 7 business days and no retainer. It is built for D2C and e-commerce teams spending about Rs 2.5 lakh / US$3,000+ a month with 60+ days of data. If the review does not surface at least three fixes you can act on that week, you can request a refund of the audit fee within 14 days of delivery; the guarantee covers actionable fixes, not a particular ROAS or CAC result. Book your audit, or view the sample report first (it asks for your name, email and phone number).
Still Launching? Get an Expert Team to Execute
Loupe needs 60+ days of data, so it is not for brands that have yet to launch. Your first real CAC will come from a well-run test, not a benchmark. If you are still launching, or want an expert team to plan and run your marketing, book a free strategy call with COACT. Deciding whether to hire help at all? Our guide on hiring growth help covers what to look for.
Frequently Asked Questions
Is there a reliable average CAC by industry in India?
No. We found no credible, India-specific, by-industry study in the sources we opened. Razorpay publishes India D2C ranges (for example ₹300-500 for beauty) without naming a source, and the dollar benchmarks are scoped to US and Western Europe. Use them as rough context only.
Can I convert the US CAC benchmark to an India figure?
Not reliably. India's Meta CPC is roughly a tenth of the global median, but CAC also depends on conversion rate, order value and competition. Multiplying a US CAC by a CPC ratio mixes two different metrics, so we do not publish a figure built that way.
Why is paid CAC higher than blended CAC?
Because blended CAC spreads spend across every new customer, including organic, referral and direct buyers. Paid CAC divides ad spend by only the customers attributed to ads. Digital Applied reports paid CAC at roughly 2.4-3.1x blended CAC.
What is the formula for CAC?
CAC equals total acquisition spend divided by new customers won in the same period. Razorpay states it as total marketing and sales costs divided by new customers acquired. Use store orders for the customer count, since platform reporting often differs from actual orders.
Sources: Digital Applied, Customer Acquisition Cost Benchmarks 2026: By Industry (Tier 4 aggregator, US/Western Europe, 21 April 2026); Razorpay, Customer Acquisition Cost: A D2C Guide (Tier 4 vendor, India, edited 15 December 2025); Superads, Facebook Ads CPC Benchmarks in India (vendor aggregate, treated as Tier 3-4, aggregated ad-account medians, July 2025 to July 2026); Nurdd, Indian D2C Ad Benchmarks 2026 (Tier 4, 12 September 2026).
Abhilash LR leads growth marketing at COACT, a performance marketing agency working with D2C and e-commerce brands in Southeast Asia and India.
Published at www.coact.biz2026-09-30 · Abhilash LRWant results like these for your brand?
COACT runs performance-based growth across SEA & India. Start with a free 15-day pilot.
Book a strategy callKeep reading
Low CPL but Poor Quality Leads: Why and How to Fix
Low CPL, poor leads? The platform is chasing cheap form-fills. Meta reports 15% lower cost per quality lead with a CRM signal. Fixes and steps inside.
How to Build a Blended CAC Report in Google Sheets
Build a blended CAC report in Google Sheets with copy-paste formulas and an illustrative example: 6,00,000 spend over 400 customers is 1,500 CAC. For D2C.