Ecommerce Conversion Rate India, Indonesia: What Vendors Say
Vendors put India's D2C conversion rate at 1.5-2.5% and Indonesia at 0.8-2.4%. See why the figures conflict and how to measure your own from store orders.
By Abhilash LR
Ask what a good ecommerce conversion rate is in India or Indonesia and you will get a tidy number. What you will not get is an audited study behind it. We found no government, academic or research-firm dataset for either country, only vendor ranges and one trade-press report. This post shows what each source says, why they conflict, and how to measure your own rate.
Key Takeaways
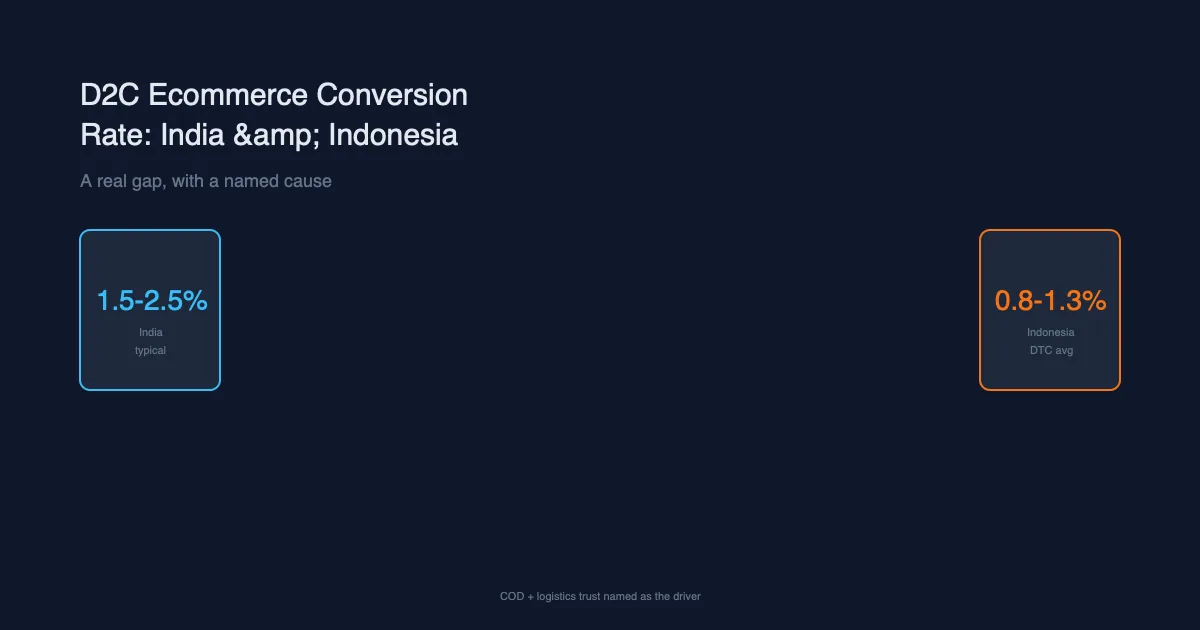
- India's vendor range is about 1.5-2.5% (Skailama, Tier 4). A Deloitte India and Shiprocket report, covered by BW Retail World in July 2026, says 1 to 2 of every 100 visitors to Indian D2C sites complete a purchase.
- Indonesia has no solid anchor. One vendor, Branch8, published 1.8-2.4% in March 2026 and 0.8-1.3% in August 2026. The March post attributes only a 2024 baseline to Statista; the August post names Shopify merchant data, Branch8's client analytics and ecommerceDB, without sample sizes.
- Category tables are directional. The one India table we found runs from 1.0% to 2.4% and names no method.
- Measure your own rate from store orders. Across the 30+ accounts we audited this year, platform-reported orders differed from actual orders by 30-40% on average.
What conversion rate do sources report for India?
Sources put India's D2C conversion rate at roughly 1 to 2.5%. The strongest anchor is a Deloitte India and Shiprocket report covered by trade press, which says 1 to 2 of every 100 visitors buy. Vendor blogs give slightly higher ranges and name no method.
BW Retail World (10 July 2026) reports that, of 100 visitors to Indian D2C sites, about 40 browse meaningfully, about 20 add to cart, 6 to 8 start checkout and 1 to 2 complete a purchase. The article states no sample size or period, so this is a reported funnel shape, not a verified benchmark. Its checkout conversion figures (41.82% in metro cities, 37.69% in Tier 3) measure a different step.
Vendors sit a little higher. Skailama lists India at 1.5-2.5% without tying it to a study. upGrowth reports 1.8-2.5% for Indian startups, from 50+ funnels it analysed across 2024-2025, with little method detail. Its own D2C table also shows a lower 1.2-1.8% band, so even this source disagrees with itself.
The practical reading: a store between 1% and 2.5% is within what these sources describe. Below 1% deserves investigation, but a benchmark alone cannot tell you why.
What does India look like by category?
One India category table exists in our research. It puts books and stationery highest at 2.4% and electronics and home furniture lowest at 1.0%. It comes from a Tier 4 report with no stated data source or method, so treat it as directional only.
Noir and Blanco's benchmark report (July 2025) lists India by category. We could not trace its underlying data. The table below is sorted from highest to lowest reported conversion rate.
| Category (India) | Reported conversion rate |
|---|---|
| Books and stationery | 2.4% |
| Grocery and essentials | 2.2% |
| Beauty and health | 2.0% |
| Kids and baby products | 2.0% |
| Pet care | 1.8% |
| Health and supplements | 1.8% |
| General ecommerce | 1.6% |
| Jewellery and accessories | 1.4% |
| Home decor | 1.3% |
| Fashion | 1.2% |
| Electronics | 1.0% |
| Home furniture | 1.0% |
The pattern is plausible, since lower-ticket items tend to convert more often than considered purchases, but that is our reading, not a verified finding. Use the closest category as a loose sanity check and weigh your own trend more heavily.
What do sources report for Indonesia?
Indonesia figures come from one consultancy, Branch8, in two posts five months apart, and they conflict: 1.8-2.4% in March 2026 and 0.8-1.3% in August 2026. We found no independent Indonesia figure for D2C stores, so treat both as unverified.
The March 2026 post gives a projected 2026 average of 1.8-2.4% for Indonesia. It attributes a 2024 baseline of 1.6% to Statista (Branch8 does not link the Statista source, so treat the baseline as unconfirmed). It also lists percentile bands for Indonesia and the Philippines together: a median of 1.2-1.7%, a bottom quartile below 0.8% and a top quartile above 2.3%.
The August 2026 post reports an Indonesia DTC store average of 0.8-1.3% and a top quartile of 2.2%. It says its country figures combine Shopify merchant data, Branch8's client analytics and ecommerceDB country reports, and it covers DTC stores only. Its FAQ gives 0.7-1.3% for Indonesia and the Philippines together, so it is not fully consistent either.
We found no Indonesia-specific category data. Branch8's category figures cover Southeast Asia as a whole, so we do not present them as Indonesian.
Why do the Indonesia numbers disagree?
We cannot confirm the cause. The likeliest explanation is scope: March describes a projected market-level average, August describes DTC stores only. A market-level projection would be expected to read higher than what independent D2C stores see. That is inference; neither post says so.
The ranges point in opposite directions. The March figure makes Indonesia look equal to India (1.8-2.4% against 1.5-2.5%); the August figure makes it clearly lower. Both cannot describe the same population.
If you run a D2C store in Indonesia, the lower range is the closer comparison to your situation, but it remains one vendor's figure. If you sell through marketplaces, neither range was built for you.
Does cash on delivery lower conversion?
Possibly, but we found no measurement proving it. Sources disagree on how common cash on delivery (COD) is in Indonesia, and none ties COD to a conversion effect. Treat the link as a plausible hypothesis, not an established cause.
Branch8's August post says COD is 20-30% of Indonesian ecommerce transactions, citing a 2025 JP Morgan Payments report. The report could not be located, and JP Morgan's Indonesia page shows no COD figures, so we cannot verify the 20-30%. A separate 2025 PCMI analysis, based on payment platform transaction data from 2024, lists COD at 8% of online shopping, behind digital wallets at 35% and bank transfers at 26%. The gap could reflect different years, bases (orders against value) or definitions.
For India, the Deloitte India and Shiprocket report (via BW Retail World) says prepaid orders are 52.68% of purchases in metro markets and 38.19% in Tier 3 cities, where cash on delivery dominates. A COD buyer must be available and pay at the door, a plausible friction point. Whether that lowers your conversion rate is something your own prepaid and COD split can show.
How do the figures compare side by side?
The table lists every figure we use with its source, region, tier and date. Tiers follow a standard scale: Tier 1 is government, academic or primary research; Tier 2 major research firms and industry bodies; Tier 3 reputable trade publications and platform documentation; Tier 4 vendor and agency blogs and aggregators. No Tier 1 or 2 source for either country turned up. The table is sorted by region, then by the low end of each range.
| Figure | Source and date | Region | Tier |
|---|---|---|---|
| 1 to 2 in 100 visitors purchase | BW Retail World, reporting Deloitte India and Shiprocket, Jul 2026 | India | 3 |
| 1.0-2.4% by category | Noir and Blanco, Jul 2025 | India | 4 |
| 1.5-2.5% typical D2C | Skailama, 2026 | India | 4 |
| 1.8-2.5% startups | upGrowth, Mar 2026 | India | 4 |
| 0.8-1.3% DTC average, 2.2% top quartile | Branch8, Aug 2026 | Indonesia | 4 |
| 1.8-2.4% projected average | Branch8, Mar 2026 | Indonesia | 4 |
| COD at 8% of online shopping | PCMI, 2024 data | Indonesia | 4 |
| 2.66% global average | Shopify, citing Dynamic Yield | Global | 4 |
Shopify's 2.66% is a global average that Shopify attributes to Dynamic Yield, which it says benchmarks "more than 400 brands". It is not an India or Indonesia figure; we include it only because it is the number most often quoted.
How do you measure your own conversion rate?
Divide completed orders by sessions over the same period, using store or analytics data rather than ad platform dashboards. Tools define the rate differently, so choose one definition and compare only like with like across periods.
Shopify defines ecommerce conversion rate as the percentage of website visits that result in a completed order, which is orders divided by visits. In GA4, the nearest metrics are session key event rate and user key event rate. Google's Analytics Data API documentation defines session key event rate as "the percentage of sessions in which any key event was triggered" and user key event rate as "the percentage of users who triggered any key event". Mark the purchase event as a key event to get a purchase-based rate. Because the session version counts sessions with a purchase, a session with two purchases counts once.
Sessions and users answer different questions. A session-based rate falls when people visit several times before buying, which is normal for higher-priced items. A user-based rate groups those visits, but depends on GA4 recognising the same person across devices and consent settings.
Do not use ad platform conversion rates as your baseline. Across the 30+ accounts we audited this year, platform-reported orders differed from actual orders by 30-40% on average, and at least 70% counted the same purchase twice in at least one platform. A rate built on those numbers overstates real performance. Our guides to conversion tracking setup and attribution and measurement cover how to reconcile them.
What should you check when your rate looks low?
Check measurement first, then traffic quality, then the page. Tracking faults and traffic mix usually explain more of a low rate than layout tweaks do, and both can be checked in the ad account before you change anything on the site.
Across the 30+ accounts we audited this year, 40% had tracking connected but not sending. Fix that before you optimise against the data, or you will optimise against a gap. Next, look at where the traffic comes from. Scaling spend often pulls in colder audiences that convert at a lower rate, a pattern we cover in why scaling budget breaks ROAS. Weaker ads attract lower-intent clicks, so creative testing belongs in the same review.
If your ads look profitable but growth has stalled, this guide explains how to separate a conversion problem from a demand problem. Only then test the post-click journey: message match, mobile speed and checkout friction.
How we gathered these figures
External figures come from the pages linked above, opened and read in October 2026. The audit statistics are COACT's own, from the same 30+ accounts we audited this year. They are internal tallies, not an independent study, and the sample is small, so treat them as indicative.
Get Your Account Audited
A benchmark cannot tell you why your own rate is where it is. Loupe is COACT's fixed-price Meta + Google Ads audit: a 133-point review framework (relevant checks vary by tier and account), priced at US$199 (Single platform), US$299 (Meta + Google) or US$399 (Full funnel), with a report in 3, 5 or 7 business days by tier and no retainer. If the report lacks at least three actionable recommendations, you can request a refund within 14 days; the guarantee covers recommendations, not a particular conversion or ROAS result. It suits brands spending about ₹2.5 lakh / US$3,000+ a month with 60+ days of data. Book your audit, or view the sample report first (it asks for your name, email and phone number).
Still Launching? Get an Expert Team to Execute
Loupe is built for accounts that already have data. If you are still launching, or want an expert team to plan and run your marketing, book a free strategy call with COACT. You can also see what COACT does.
Frequently Asked Questions
What is a good conversion rate for a D2C store in India?
Sources describe roughly 1 to 2.5% as typical. A Deloitte India and Shiprocket report, via BW Retail World, says 1 to 2 of 100 visitors buy, and vendor blogs say 1.5-2.5%. Category matters: the one table we found runs from 1.0% to 2.4%. Use these as reference points, not a pass mark.
What is a good conversion rate in Indonesia?
We cannot give one number with confidence. Branch8 reports 0.8-1.3% for DTC stores (August 2026) and a 1.8-2.4% projected average (March 2026). For a D2C store the lower range is the closer comparison, but it is one vendor's unverified figure.
Is Indonesia's conversion rate lower than India's?
Not provably. The 0.8-1.3% Indonesia range sits below India's, but Branch8's own 1.8-2.4% overlaps it. The sources use different scopes, and none compares both countries on one definition.
Does cash on delivery lower conversion rate?
It may, but we found no measurement showing it. Indonesian COD estimates run from 8% (PCMI, 2024 data) to 20-30% (Branch8, citing a report that could not be located). To test it yourself, compare conversion and order completion between prepaid and COD checkouts.
Why is my GA4 conversion rate different from Shopify's?
They count differently. Shopify's rate is orders divided by visits. GA4's session key event rate counts sessions in which a key event fired, so repeat purchases in one session count once. Consent settings and blocked tags can also hide sessions in one tool but not the other.
What if my conversion rate is below these ranges?
Confirm that tracking sends events and purchases are not double counted, then look at traffic quality and creative before redesigning pages. For an outside review of the ad account and the data feeding it, that is what Loupe does.
Sources: BW Retail World, Only 1-2 of every 100 visitors complete purchase on Indian D2C sites (Tier 3, July 2026, reporting Deloitte India and Shiprocket); Skailama, Ecommerce Conversion Rate by Industry (Tier 4, 2026); upGrowth, Conversion Rate Benchmarks for Indian Startups (Tier 4, March 2026); Noir and Blanco, Ecommerce Conversion Benchmark Report (Tier 4, July 2025); Branch8, Southeast Asia Ecommerce Conversion Benchmarks (Tier 4, March 2026); Branch8, Southeast Asia DTC Conversion Rate Benchmarks (Tier 4, August 2026); PCMI, Indonesia payments and ecommerce trends (Tier 3, 2024 data); Shopify, Ecommerce Conversion Rate (Tier 3, platform content citing Dynamic Yield); Google Analytics Data API metrics (Tier 3, platform documentation).
Abhilash LR is the founder of Coact and leads its growth marketing work with performance and D2C brands across India, Singapore, and Indonesia. Coact is a performance and growth marketing agency operating in Singapore, India, and Indonesia.
Want results like these for your brand?
COACT runs performance-based growth across SEA & India. Start with a free 15-day pilot.
Book a strategy callKeep reading
Southeast Asia CAC Benchmarks 2026: What Data Exists
Singapore's median Meta CPC is near the global median (SGD 1.00 vs 1.04); the Philippines' is 93% lower. No SEA CAC-by-industry study exists; see the data.
Ads Profitable But Not Growing? Why a Good ROAS Isn't Profit
Ads look profitable but the business isn't growing? Break-even ROAS is 1 divided by margin. At a 60% margin it is 1.67x, so a 1.5x ROAS loses money per sale.