Google Ads vs Meta Ads for Ecommerce in Southeast Asia
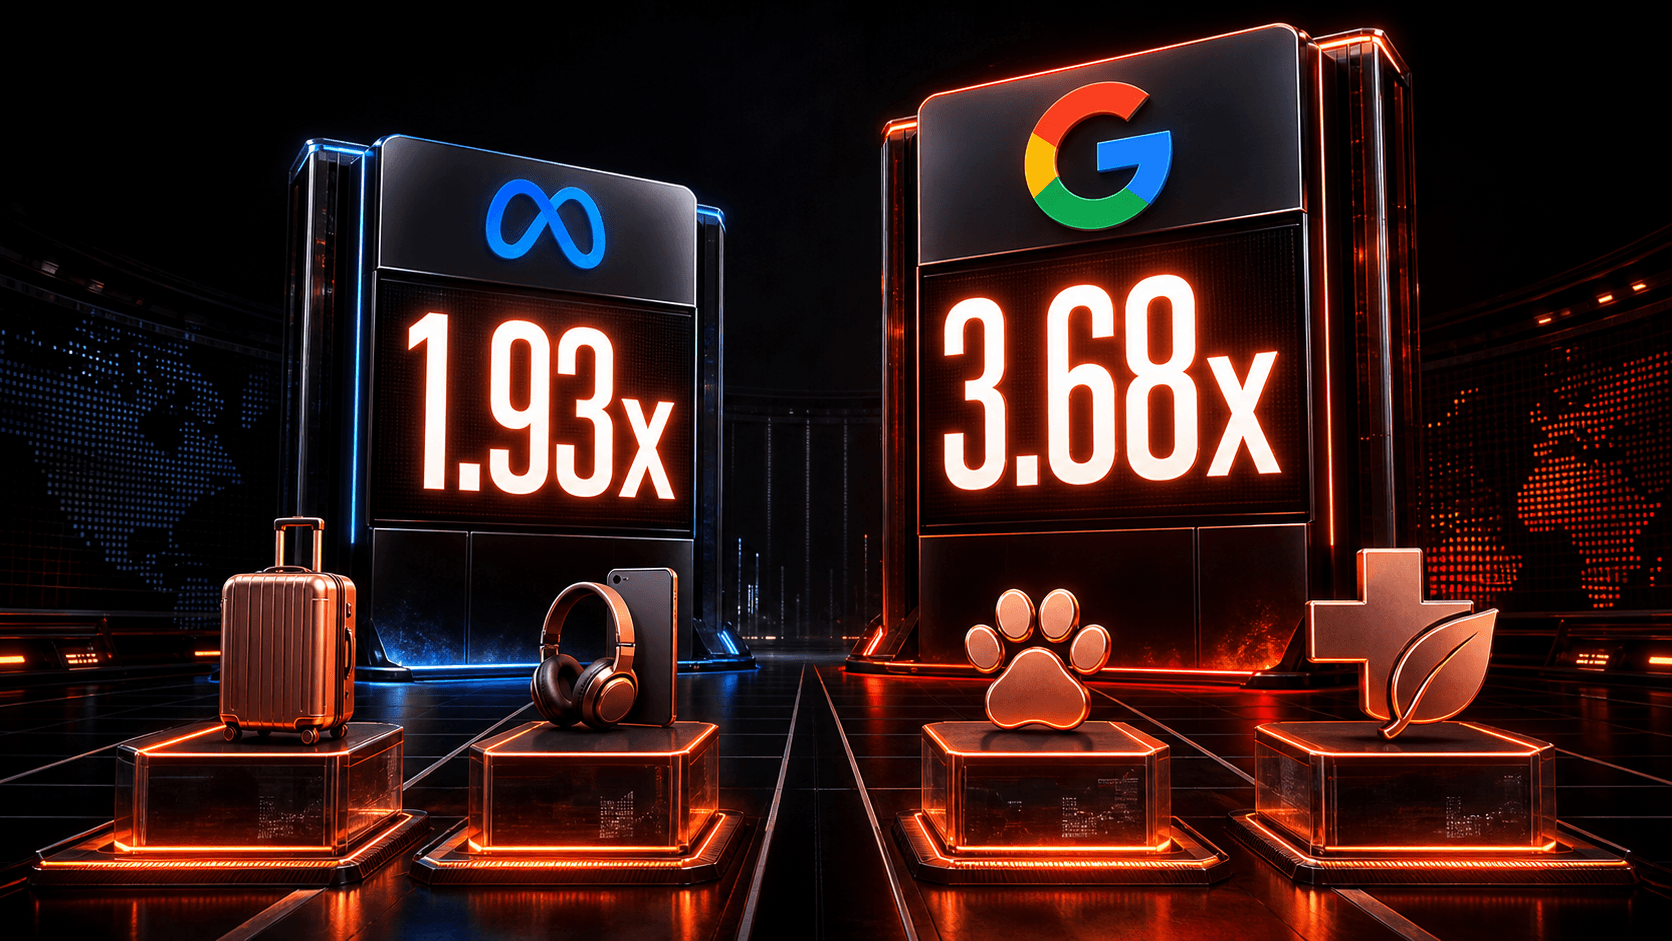
Median ecommerce ROAS runs 3.68x on Google Ads versus 1.93x on Meta — but in Southeast Asia, the cost side changes the math. Here's the verified data.
By Abhilash LR
Neither platform wins outright — they do different jobs, and in Southeast Asia the data is lopsided in an unusual way. On return on ad spend (ROAS), the best available large-sample data favors Google: median ecommerce ROAS runs 3.68x on Google Ads versus 1.93x on Meta across 18,000 brands (Triple Whale, 2025). But on cost, the only country-level SEA benchmark data that exists is for Meta — where clicks in India and the Philippines run 90%+ below the global median. No equivalent public Google Ads benchmark for the region exists at all. That asymmetry, not a simple "which is better" verdict, should shape how an ecommerce brand in this region splits budget.
This post lays out what's actually verifiable on both sides, where the data gaps are, and how to structure a Google-plus-Meta budget for ecommerce in Singapore, India, and the rest of Southeast Asia. The underlying regional cost data comes from our CAC and CPC benchmarks for Southeast Asia and India.
Key Takeaways
Median ecommerce ROAS is 3.68x on Google Ads versus 1.93x on Meta across 18,000 brands — but that gap largely reflects funnel position, not platform quality (Triple Whale, 2025).
Meta CPC in India runs $0.11 and the Philippines $0.069 against a $1.07 global median (Superads, Jul 2025-Jul 2026) — cheap demand creation that has no Google-side equivalent in the public data.
No credible country-level Google Ads CPC benchmark exists for Southeast Asia. The most-cited industry report is explicitly US-only.
The only SEA-specific cross-channel effectiveness study we could verify is Meta-commissioned — usable, but with that caveat attached.
The ROAS Data Favors Google — For a Structural Reason
Across 18,000 ecommerce brands, median return on ad spend is nearly twice as high on Google Ads (3.68x) as on Meta (1.93x) in Triple Whale's 2025 dataset. Before treating that as a verdict, look at what each platform is doing when the conversion happens. Google Search captures a shopper who has already typed a buying intention — "wireless earbuds under $50" — so revenue attributes cleanly and quickly to the click.
Meta interrupts someone who wasn't shopping and starts a journey that may convert days or weeks later, often through a branded search that Google then gets credit for. A last-click lens systematically flatters the platform closest to checkout, which is exactly where Google Search sits. So the honest reading of the 3.68x-vs-1.93x gap: Google harvests demand more efficiently, but a meaningful share of the demand it harvests was created somewhere else — including on Meta.
Grouped bar chart showing median ecommerce ROAS across 18,000 brands: Meta 1.93x, Google Ads 3.68x. Source: Triple Whale, 2025 data.1.93xMeta3.68xGoogle AdsSource: Triple Whale, Google/Facebook Ads Benchmarks, retrieved 2026-07-09
Source: Triple Whale, Google Ads & Facebook Ads Benchmarks, retrieved 2026-07-09
Caveat worth stating plainly: the Triple Whale dataset is global, dominated by North American ecommerce brands, and not SEA-specific. We could not find an equivalent large-sample, disclosed-methodology ROAS comparison for Southeast Asia specifically — so this is the best available directional data, not a regional benchmark.
What Ad Costs Look Like in Southeast Asia — On One Platform, Anyway
The cost side is where Southeast Asia stops resembling the global picture. Meta's click costs in the region's two largest English-language ad markets run far below the global median: India's median Facebook Ads cost-per-click is $0.11 and the Philippines' is $0.069 against a $1.07 global median (Superads, July 2025-July 2026, aggregated ad-account data). Singapore is the region's exception, sitting near global norms at roughly $0.82 converted from SGD. Indonesia is a deliberate omission here, not an oversight: Superads returns chart data for Indonesia, Malaysia, and Thailand, but without the currency confirmation its Singapore, India, and Philippines pages carry, so we've excluded those figures rather than guess — the same call we made in our regional benchmarks post.
Lollipop chart of Facebook Ads median cost per click. Philippines 0.069 dollars, India 0.11 dollars, Singapore approximately 0.82 dollars converted from SGD, Global median 1.07 dollars. Source: Superads, July 2025 to July 2026.Philippines$0.069India$0.11Singapore (~USD)$0.82Global median$1.07Source: Superads, Facebook Ads CPC Benchmarks, retrieved 2026-07-09
Source: Superads, Facebook Ads CPC Benchmarks, retrieved 2026-07-09
Here is the asymmetry most comparison articles skip: there is no equivalent public dataset for Google Ads. We went looking for a country-level Google Ads CPC benchmark covering Singapore, India, Indonesia, or the Philippines and found none with a disclosed methodology. The most widely cited Google Ads benchmark report — WordStream's 2026 edition, which puts average CPC at $5.42 — states in its own methodology that it is based on 13,474 US-based search advertising campaigns (WordStream, April 2025-March 2026 data).
Any article quoting a "Google Ads CPC in Southeast Asia" figure is therefore almost certainly relabeling US or global data. Google Ads CPCs in emerging markets are widely understood to run below US levels, but "widely understood" is not a benchmark, and we won't dress it up as one.

Practical implication: for SEA-focused planning, you can budget Meta with country-level cost data and a stated date range. For Google, you'll be working from your own account history or a test budget — not from public benchmarks. That's an argument for starting Google spend conservatively and letting your own CPC data accumulate before committing a full-scale budget split.
Which Platform Fits Which Job?
The two platforms are complements, not substitutes, and the cleanest way to see it is side by side:
DimensionGoogle AdsMeta AdsShopper intent at exposureActive — typed a searchPassive — interrupted mid-scrollFunnel roleDemand harvestingDemand creation + retargetingMedian ecommerce ROAS (global, Triple Whale 2025)3.68x1.93xPublic SEA country-level cost dataNone with disclosed methodologyYes — Superads CPC by countryCatalog-scale automationPerformance Max, ShoppingAdvantage+ ShoppingAttribution flatteryOvercredited by last-click (closest to checkout)Undercredited by last-click (earlier in journey)
The one SEA-specific cross-channel effectiveness study we could verify points the other way from the global ROAS table — with a large asterisk. A Kantar study covering Thailand, the Philippines, Indonesia, and Vietnam found Meta delivered the highest ROAS of the channels tested at 1.8x, contributing 16% of incremental sales from just 10% of media spend (July 2024). The asterisk: the study was commissioned by Meta, excludes Singapore and India entirely, and measured incremental sales across FMCG-style categories rather than pure-play ecommerce. It's a real methodology with a real conflict of interest — treat it as one input, the same way we did in our regional benchmarks post.
How Should an SEA Ecommerce Brand Split Budget Between Them?
Start from search volume, not from a formula. If meaningful search demand for your category already exists — people are typing your product category or brand into Google — fund Search and Shopping first, because un-harvested existing demand is the cheapest revenue available. Then put Meta to work on the job Google can't do at these prices: creating demand. At $0.07-$0.11 per click in the Philippines and India, Meta prospecting in those markets costs a tenth of what the same top-of-funnel motion costs in the US, which changes how much experimentation a modest budget buys.
In the ecommerce accounts we work with across Singapore, India, and Indonesia, the practical failure mode is rarely picking the "wrong" platform — it's funding both but judging them by the same number. The team sees Google's ROAS at 3-4x and Meta's at 1.5-2x, concludes Meta is broken, and cuts the prospecting budget; branded search volume then erodes over the following quarter, and Google's "efficient" ROAS quietly declines with it, because part of what Google was harvesting is demand Meta had been creating.
A workable default for an SEA ecommerce brand with existing search demand: fund branded and high-intent Search/Shopping to their natural impression-share ceiling first, hold each platform to its own target (built from your margins — the arithmetic is in our break-even ROAS explainer), and treat Meta prospecting spend in low-CPC markets as the growth lever you scale once tracking is trustworthy. If you're pre-search-demand — a new brand nobody is googling yet — invert it: Meta creates the demand first, and Google Search enters once branded queries appear.
Common Mistakes When Running Both Platforms
Holding Meta and Google to the same ROAS target. The medians differ by nearly 2x on the same underlying businesses — a shared target guarantees one platform always looks broken.
Cutting Meta prospecting because last-click undervalues it, then watching branded search — and Google's ROAS — decline a quarter later.
Importing US benchmark costs into SEA planning. A $5.42 average CPC from a US-only dataset has no bearing on markets where Meta clicks cost $0.07-$0.11; plans built on it will misjudge both budget requirements and expected efficiency.
Reading the Meta-commissioned Kantar study — or any sponsor-funded study — without the sponsorship caveat. The methodology can be real and the incentive still matters.
Frequently Asked Questions
Is Google Ads or Meta Ads better for ecommerce in Southeast Asia?
Neither is better outright — Google harvests existing search demand more efficiently (3.68x median ecommerce ROAS versus Meta's 1.93x globally), while Meta creates demand at exceptionally low cost in SEA markets ($0.069-$0.11 CPC in the Philippines and India versus a $1.07 global median). Most working SEA ecommerce stacks run both, with different targets for each.
Why is Google Ads ROAS so much higher than Meta's?
Mostly funnel position. Google Search captures shoppers who already typed a buying intention, so conversions attribute cleanly to the click, while Meta starts journeys that often convert later through branded search — which last-click attribution then credits to Google. The gap reflects where each platform sits relative to checkout as much as raw efficiency.
What is the average Google Ads CPC in Southeast Asia?
No credible country-level benchmark exists. The most-cited industry figure ($5.42 average CPC, WordStream 2026) comes from an explicitly US-only sample of 13,474 campaigns. Plan Google spend in SEA from your own account data or a test budget, not from published benchmarks.
Should a new ecommerce brand in SEA start with Google or Meta?
If nobody is searching for your category or brand yet, start with Meta — demand creation has to precede demand harvesting, and SEA's low CPCs make that affordable. If search demand already exists, fund high-intent Search and Shopping first, since un-harvested existing demand is the cheapest revenue available.
How much cheaper are Meta Ads in Southeast Asia than globally?
India's median Facebook Ads CPC is $0.11 and the Philippines' is $0.069, against a $1.07 global median — roughly 90-93% below it (Superads, July 2025-July 2026). Singapore is the exception, sitting near global norms at approximately $0.82 converted from SGD.
Can I trust the Kantar study showing Meta delivers 1.8x ROAS in SEA?
Use it with its caveats attached: it's a real methodology covering Thailand, the Philippines, Indonesia, and Vietnam, but it was commissioned by Meta, excludes Singapore and India, and measured incremental sales in FMCG-style categories rather than pure-play ecommerce. Treat it as one directional input, not a planning benchmark.
Conclusion
The Google-vs-Meta question in Southeast Asia isn't a contest with a winner — it's an allocation problem with unusually asymmetric data. Google's ROAS advantage is real but structurally inflated by last-click attribution. Meta's cost advantage in India and the Philippines is real and verifiable at the country level; Google's regional costs simply aren't publicly benchmarked at all. Fund existing search demand first, use cheap Meta clicks to create the demand you don't have yet, and judge each platform against its own target rather than a shared number.
How this comparison was compiled: every figure traces to a named, dated source — Triple Whale's 18,000-brand global dataset (2025), Superads' aggregated ad-account CPC data (July 2025-July 2026, with SGD-to-USD conversion noted where applied), WordStream's 2026 benchmark report (13,474 US-only campaigns, April 2025-March 2026, cited specifically to show its US-only scope), and the Meta-commissioned Kantar study (July 2024, caveats stated inline) — each verified directly against the source as of July 10, 2026. We found no country-level Google Ads CPC benchmark for Southeast Asia with a disclosed methodology as of that date, and have said so rather than substituting US or global data. Coact is a performance marketing agency working with ecommerce and app businesses across Singapore, India, and Indonesia.
Continue Learning
Real CAC Benchmarks for Southeast Asia & India (2026) — the country-level CPC and revenue-per-install data behind this post
What's a Good ROAS by Industry? (2026 Benchmark Data) — the break-even arithmetic behind platform-specific ROAS targets
Talk to our team about structuring a Google + Meta budget for your market.
Want results like these for your brand?
COACT runs performance-based growth across SEA & India. Start with a free 15-day pilot.
Book a strategy callKeep reading
Ecommerce Conversion Rate India, Indonesia: What Vendors Say
Vendors put India's D2C conversion rate at 1.5-2.5% and Indonesia at 0.8-2.4%. See why the figures conflict and how to measure your own from store orders.
Southeast Asia CAC Benchmarks 2026: What Data Exists
Singapore's median Meta CPC is near the global median (SGD 1.00 vs 1.04); the Philippines' is 93% lower. No SEA CAC-by-industry study exists; see the data.